


Let's take a look at what this means:
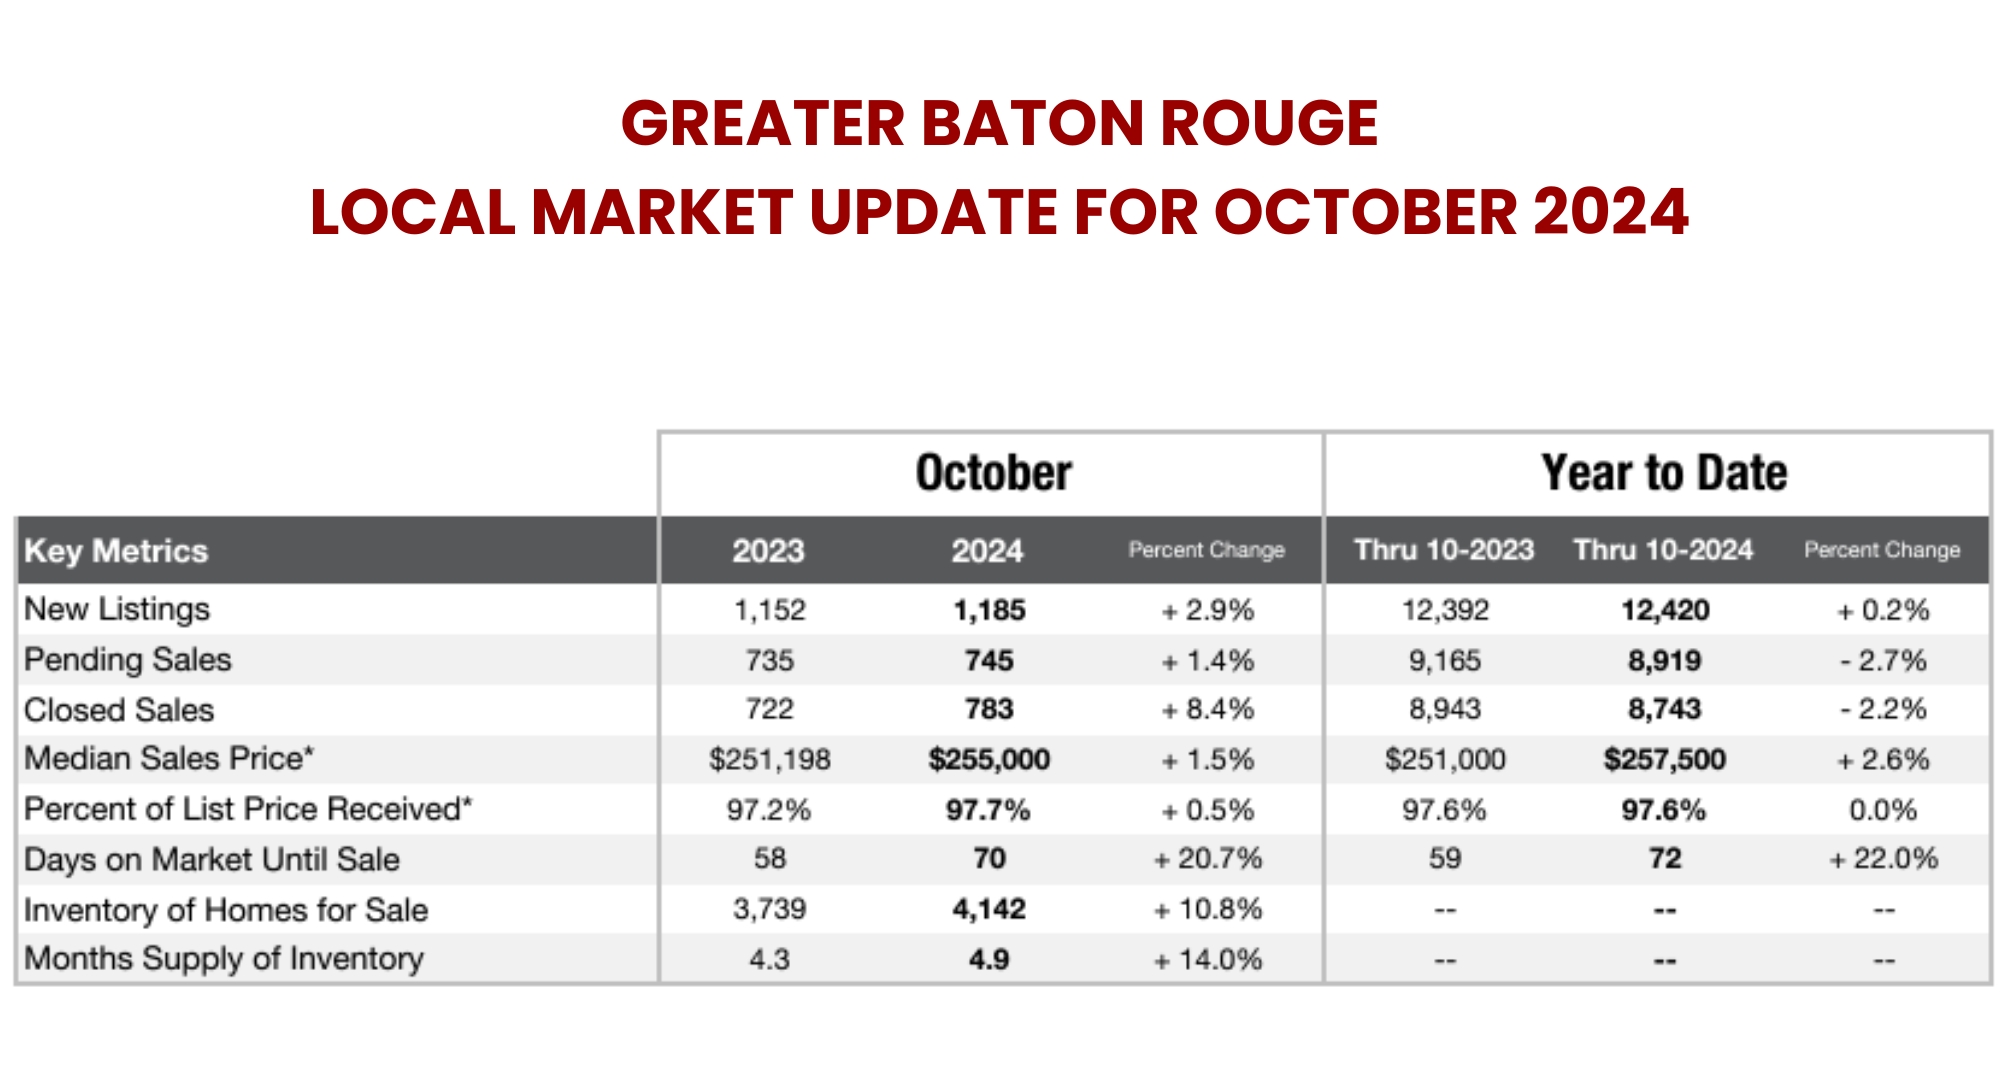
Year to Date: New listings have risen only .2% over last year, still showing lack of sellers entering the market. Pending and closed sales dropped year to date over last year, evidenced by the slow down this fall. Days on market for the year are hovering at the 70 day mark like in October. Year to date median sales price rose to $257,500, up over last years median at $251,000.
October: Forget the last 9 months, let's see what is happening now! In October, new listings rose, pending sales rose, closed sales rose and the median sales price increased to $255,000. The percentage of list price to sales was a resounding 97.7% of list price ... all good news indeed. And, last but not least, the homes in inventory increased a resounding 10.8% ... giving you more options as a buyer, but more competition as a seller.
What does this all mean? While the buying pool has retracted 2% over last year, days on market remains way below 3 months, the percentage of sales price to list price is very strong, AND the good news is that pendings and closed sales are rising! Closed sales were up 8% over October of last year.
Could the slump be over? We believe so as evidenced by a return of multiple offers on some listings and buyers putting homes under contract that have been on the market over 70 days. The market appears to be coming back!
Our advice: As a buyer, be prepared for multiple offers returning. As a seller, go to market promptly before inventory increases and you have greater competition. Seize the moment!
Vote and watch real estate rebound!


